Feature Summary
Cross-tabulation analysis is used to perform multi-dimensional cross-tabulation on data collected from questionnaires. By defining row and column dimensions, you can analyze the correlation between different questions.
Feature Description
| Feature Dimension | Description |
|---|---|
| Member restriction | No member restriction |
| Version restriction | No version restriction |
Operating Steps
Use Cross-Tabulation Analysis
Feature Entry
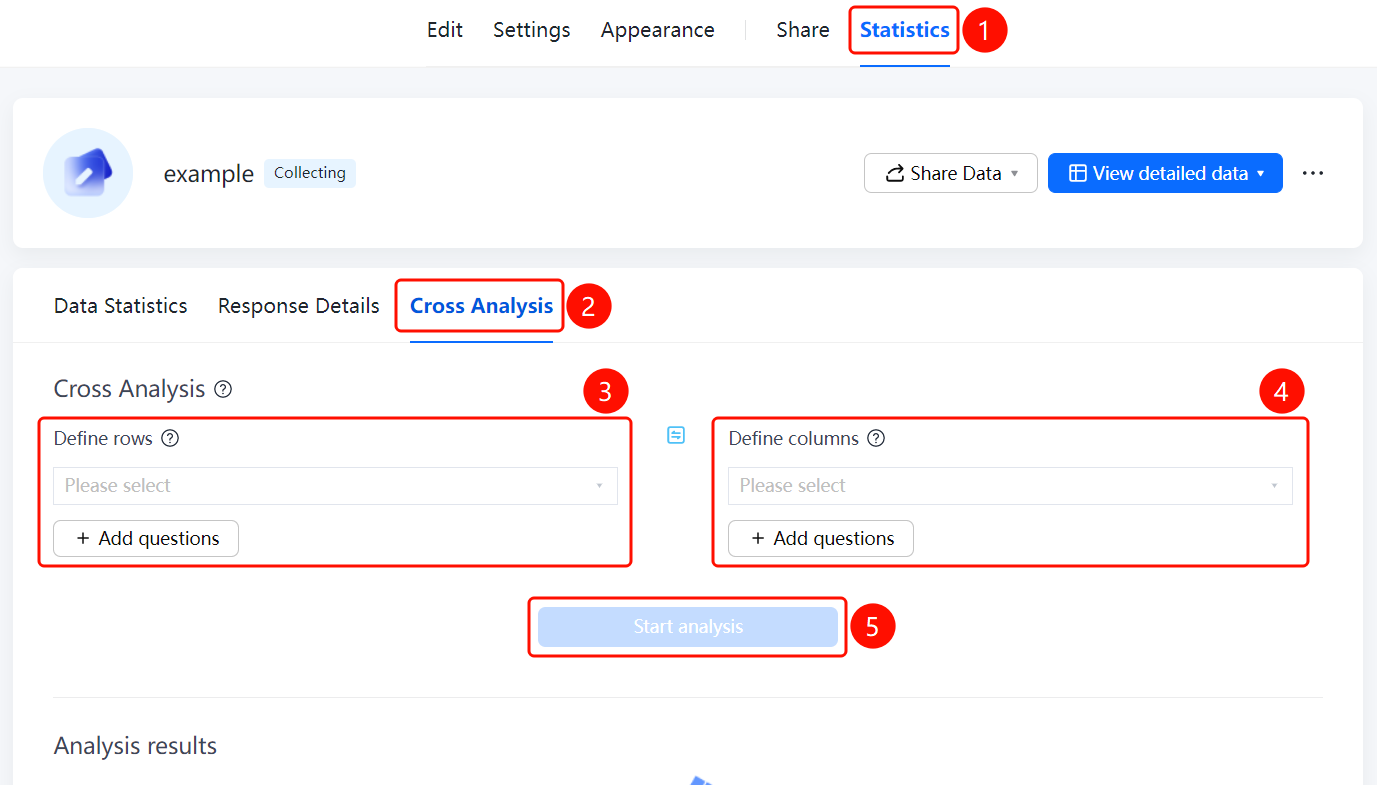
"Statistics" tab → "Cross-Tabulation" option
- Click the "Statistics" tab at the top.
- Click the "Cross-Tabulation" tab next to "Data Statistics" and "Response Details".
- Click the dropdown list in the "Define Row" area and select the question to be used as the row dimension.
- Click the dropdown list in the "Define Column" area and select the question to be used as the column dimension.
- Click "Add Question" to add more analysis dimensions.
- Click the "Start Analysis" button to view the analysis results below.
FAQ
Question 1: What is the use of cross-tabulation analysis?
- Solution: Cross-tabulation analysis can perform cross-tabulation on data from two or more questions to help analyze the correlation between different questions, such as analyzing the distribution among different options.
Question 2: How do I select the dimensions for cross-tabulation analysis?
- Solution: Click the "Define Row" and "Define Column" dropdown lists to select the questions to be analyzed, or click "Add Question" to add more dimensions.
Question 3: How do I view the analysis results?
- Solution: After setting the row and column dimensions, click the "Start Analysis" button. The analysis results will be displayed in the "Analysis Results" area below.
Notes
- Cross-tabulation analysis is applicable to question types with options, such as multiple-choice questions and dropdown questions.
- You must define at least two dimensions, row and column, to perform the analysis.