Feature Summary
The chart feature supports visualizing spreadsheet data with 50+ chart types, including bar charts, line charts, and pie charts, to intuitively present data relationships and trends.
Feature Description
| Feature Dimension | Description |
|---|---|
| Membership Restriction | Some styles require a membership subscription |
| Version Restriction | No version restrictions |
Operation Steps
Insert Chart
Feature Entry
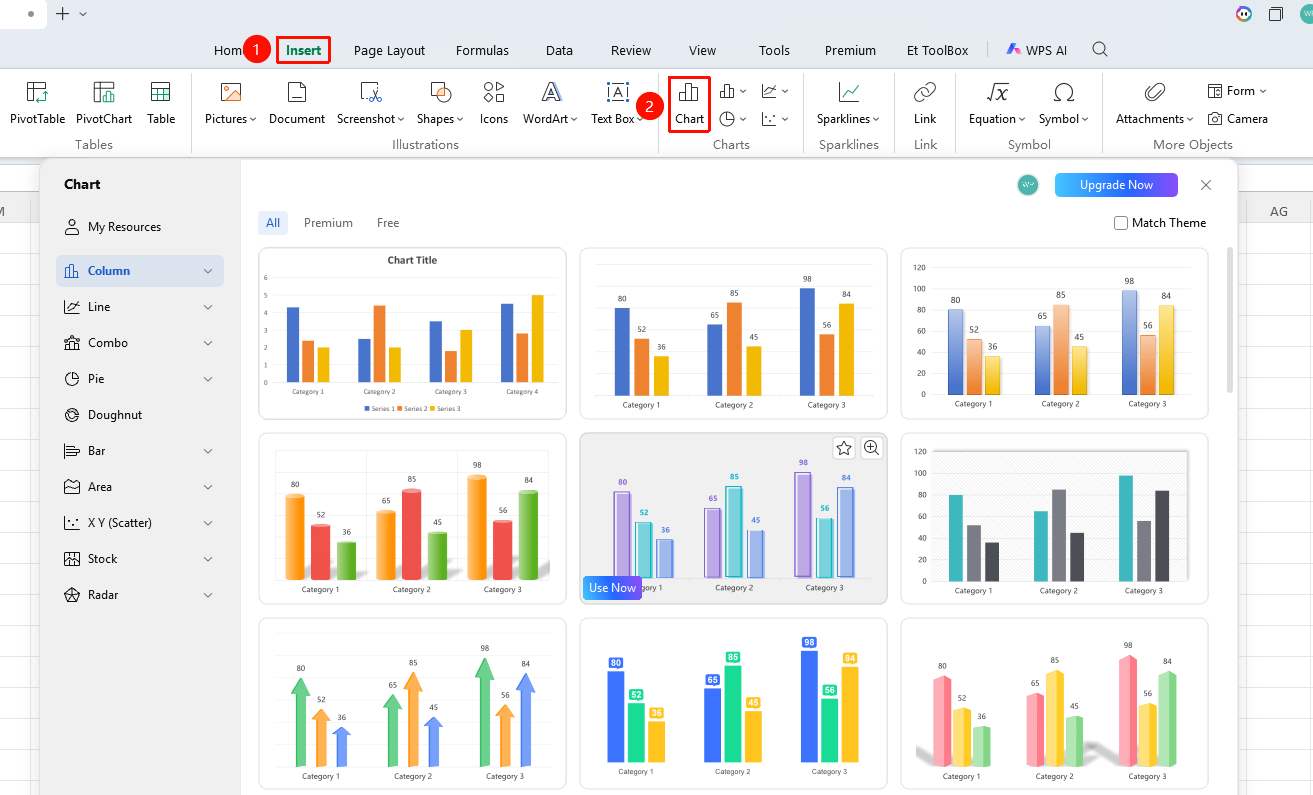
"Insert" tab → "Chart" button
- Organize the spreadsheet data you want to visualize
- Click the "Chart" button in the "Insert" tab
- In the pop-up dialog, select the chart category on the left (Column, Line, Pie, and so on) and the specific sub-style on the right
- The chart will be automatically inserted into the current worksheet
Quick Chart Generation
Feature Entry
Shortcut key F11 (mac: Fn+F11) or Alt+F1 (mac: Alt+Fn+F1)
- Select the complete data range including header row and values
- Press
F11(mac:Fn+F11) to generate a default column chart in a new standalone worksheet with one click - Or press
Alt+F1(mac:Alt+Fn+F1) to insert a default column chart in the current worksheet - After generation, you can modify the chart type, color scheme, and layout via "Chart Tools"
Edit Chart
Feature Entry
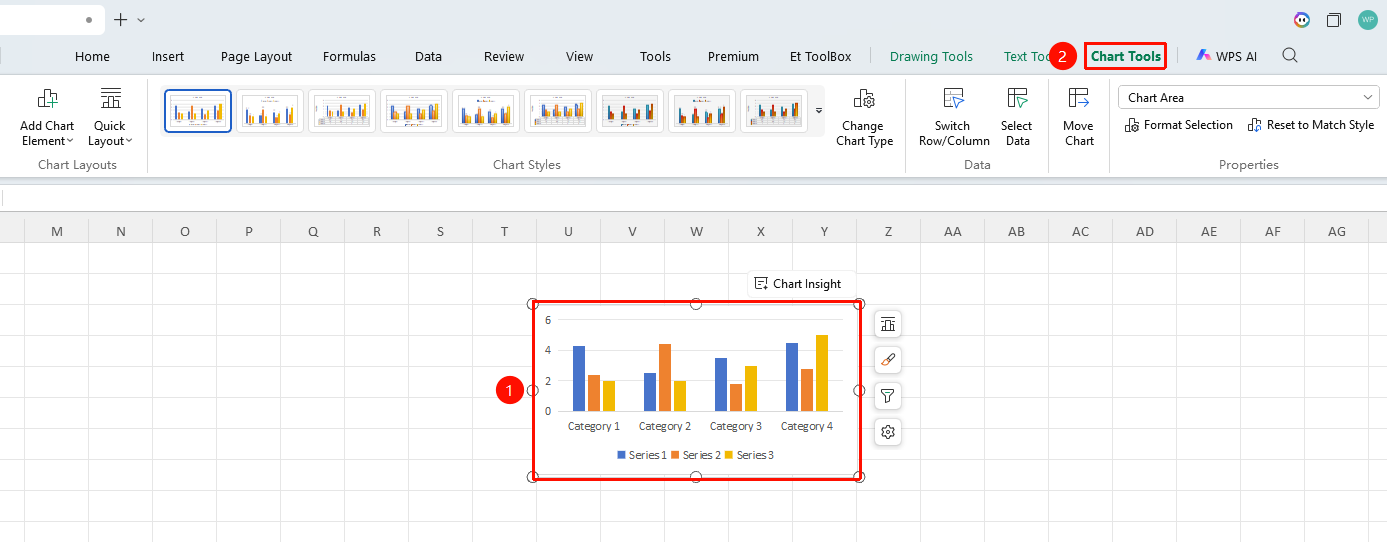
Select chart → "Chart Tools" tab
- After clicking to select the chart, the "Chart Tools" tab automatically appears on the ribbon, containing the following common buttons: Add Element, Quick Layout, Change Type, Switch Row/Column, Select Data, Move Chart, Format, Reset Style
- Click the "Change Type" button to modify the chart type in the pop-up window
- Use the "Add Element" drop-down button to add elements such as chart title, data labels, legend, trendline, and error bars
- A floating toolbar will appear on the right side of the chart, providing quick access to chart styles, element editing, filtering, settings, etc.
- After selecting the chart or a chart element, right-click and select "Format Object" to fine-tune styles such as color, font, and border in the right-side properties panel
Export Chart as Image
Feature Entry
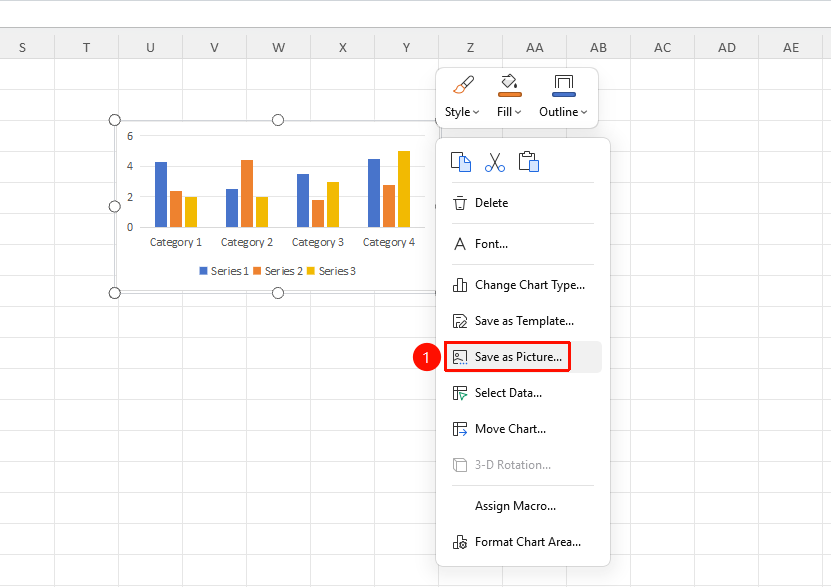
Select chart → Right-click → "Save as Picture"
- After clicking to select the chart, right-click on the chart
- Select "Save as Picture" from the pop-up menu
- In the pop-up window, choose the save path and image format (JPEG, PNG, and so on), then click Save
Frequently Asked Questions
Q1: How to modify the chart data source?
- Solution: Right-click the chart and select "Select Data". In the pop-up window, you can modify the data range for the data series and category axis.
Q2: Can the chart type be changed at any time?
- Solution: Yes. After selecting the chart, click "Chart Tools" → "Change Type" to switch to another chart type at any time. The data will automatically adapt.
Q3: How to delete a specific data series from the chart?
- Solution: Right-click the chart and select "Select Data". In the data series list, select the series you want to delete and click "Delete".
Q4: How to display data as percentages on the chart?
- Solution: After selecting the chart, click "Chart Tools" → "Add Element" → "Data Labels" → select "Percentage". Alternatively, right-click the data labels and select "Format Data Labels" for detailed settings.
Q5: What should I do if I find the data is incomplete after inserting the chart?
- Solution: Right-click the chart and select "Select Data", then re-select the correct data range in the pop-up window. If rows or columns have been added or deleted from the original data, it is recommended to delete the chart and re-insert it to ensure accurate data matching.
Notes
- It is recommended that the data range include headers, so the chart can automatically recognize series names.
- For complex data, it is recommended to choose the chart type that best conveys the data relationships.
- After insertion, the chart can be dragged to adjust its size and position at any time.
- When a chart is selected, the "Chart Tools" tab is only displayed while the chart is in the selected state; clicking on any other area will automatically hide it.