Feature Summary
Sparklines can generate small charts within a single cell to visually display data trends, supporting three types: Line, Column, and Win/Loss.
Feature Description
| Feature Dimension | Description |
|---|---|
| Membership Restriction | No version restriction |
| Version Restriction | File must be in XLSX format (XLS format does not support sparklines) |
Operation Steps
Insert a Line Sparkline
Feature Entry
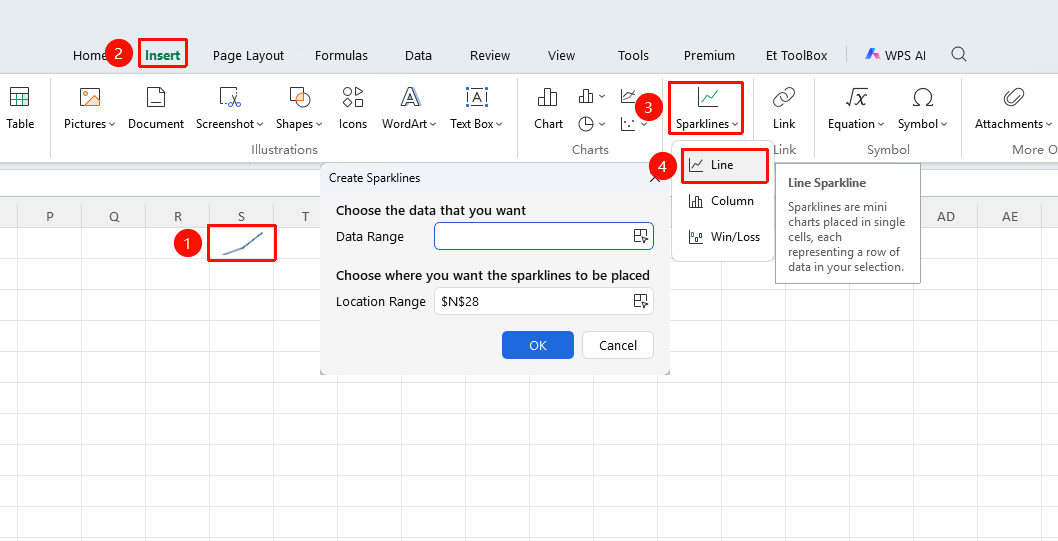
"Insert" tab → Drop-down button below the "Sparklines" button → "Line" option
- Select the target cell where you want to insert the sparkline (e.g., H2)
- Click the Insert tab
- Click the drop-down button below the "Sparklines" button
- Click the "Line" option again
- In the pop-up "Create Sparklines" window, select the data range to be analyzed (e.g., B2:G2)
- Confirm the location range is the pre-selected target cell
- Click OK to complete the insertion
Insert a Column Sparkline
Feature Entry
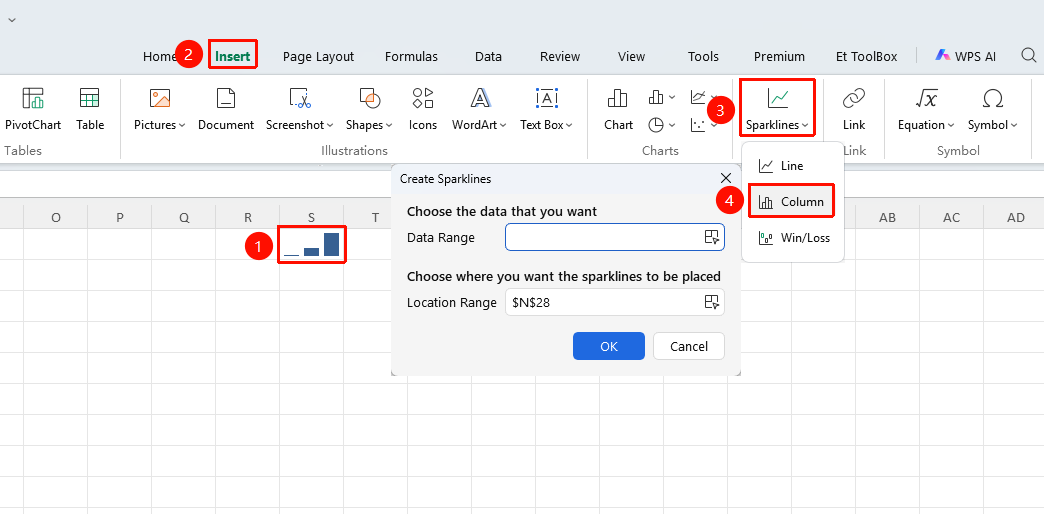
"Insert" tab → Drop-down button below the "Sparklines" button → "Column" option
- Select the target cell where you want to insert the sparkline (e.g., H2)
- Click the Insert tab
- Click the drop-down button below the "Sparklines" button
- Click the "Column" option again
- In the pop-up "Create Sparklines" window, select the data range to be analyzed (e.g., B2:G2)
- Confirm the location range is the pre-selected target cell
- Click OK to complete the insertion
Insert a Win/Loss Sparkline
Feature Entry
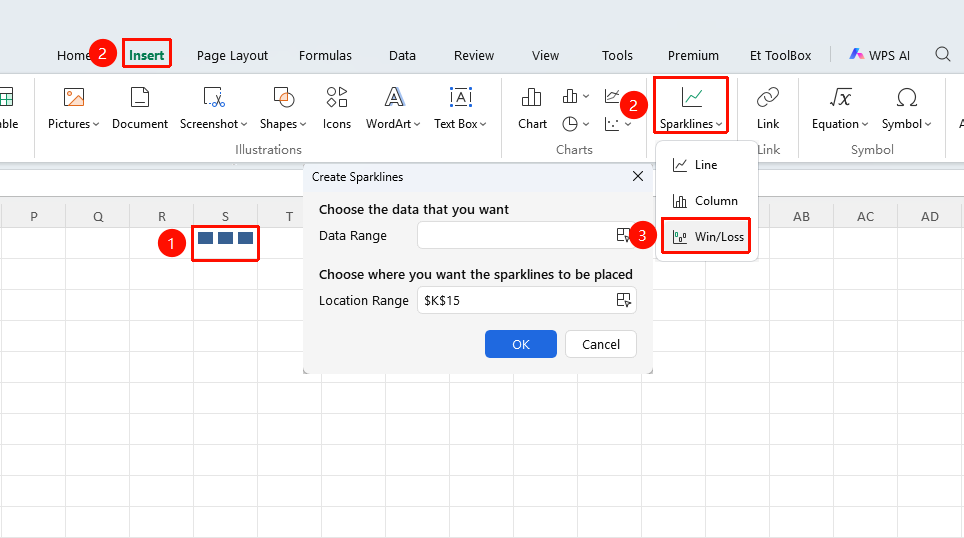
"Insert" tab → Drop-down button below the "Sparklines" button → "Win/Loss" option
- Select the target cell where you want to insert the sparkline (e.g., H2)
- Click the Insert tab
- Click the drop-down button below the "Sparklines" button
- Click the "Win/Loss" option again
- In the pop-up "Create Sparklines" window, select the data range to be analyzed (e.g., B2:G2)
- Confirm the location range is the pre-selected target cell
- Click OK to complete the insertion
Edit Sparklines
Feature Entry
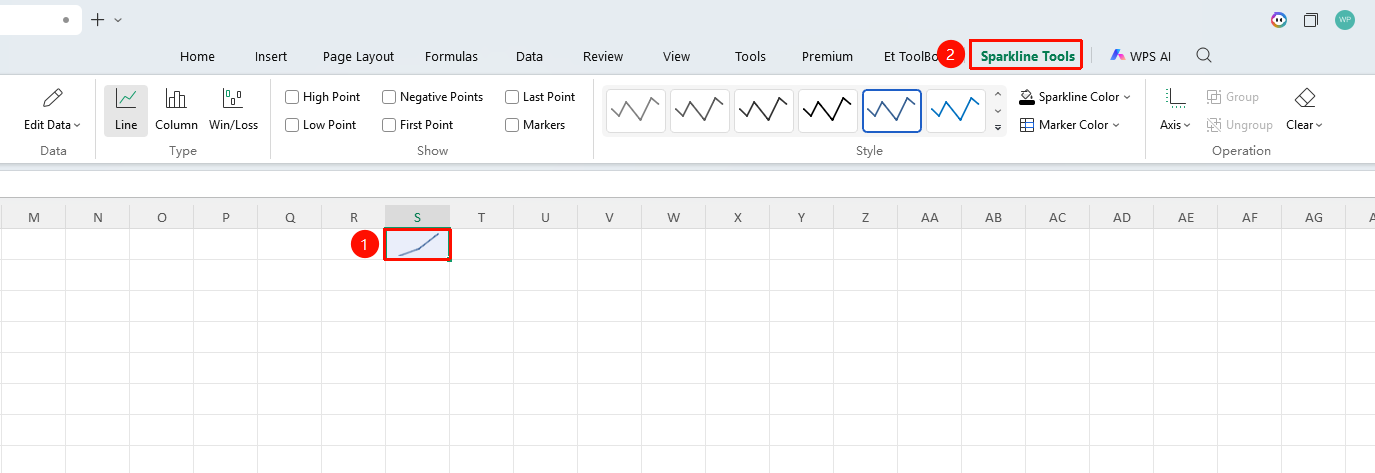
Select the sparkline → "Sparkline Tools" tab
- Select the cell containing the sparkline, and the "Sparkline Tools" tab will appear on the ribbon
- You can modify the sparkline type (Line/Column/Win/Loss)
- You can set the display of high points, low points, negative points, markers, etc.
- You can adjust the color and style of the sparkline
Delete Sparklines
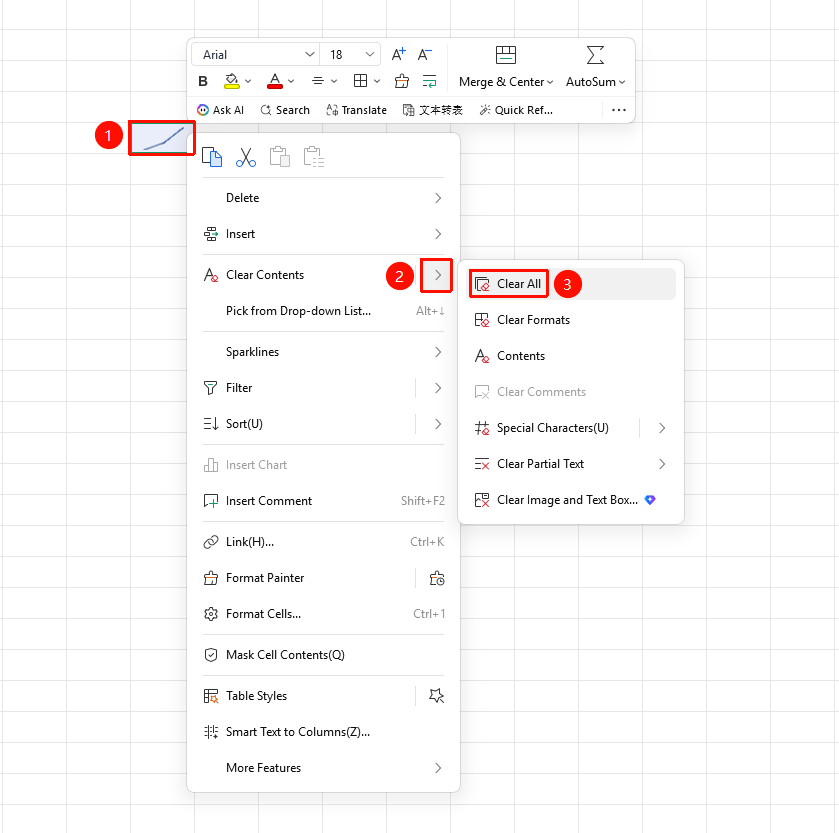
- Right-click the cell containing the sparkline
- Select "Clear Contents" → "All" to delete it
Frequently Asked Questions
Question 1: What should I do if the Sparklines option is grayed out?
- Solution: Sparklines do not support the XLS format. Save the file in XLSX format and reopen it to use the feature.
Question 2: What is the difference between sparklines and regular charts?
- Solution: Sparklines are embedded within a single cell, are compact and lightweight, and are suitable for displaying data trends; regular charts occupy a separate area, have more complete functionality, and are suitable for detailed data visualization.
Question 3: Can sparklines be generated in batches?
- Solution: Yes. After inserting one sparkline, drag the fill handle at the bottom-right corner of the cell downward to fill, and corresponding sparklines will be generated in batches for each row of data.
Notes
- The data source for a sparkline supports a maximum of 128 data points
- Each sparkline displays the trend of only one data series